The ZFS-UI app icon: a stack of three teal disk platters

Every ZFS pool you run,
on one screen.

ZFS-UI is a native macOS app that monitors ZFS pools on remote servers over SSH. Pool health and the full vdev tree, datasets and zvols, every drive with its SMART data, ARC and L2ARC behaviour, and live I/O per device — collected with read-only commands, with nothing to install on the server.

Native AppKit · sandboxed · no agent on the server

What it shows you

Pool state

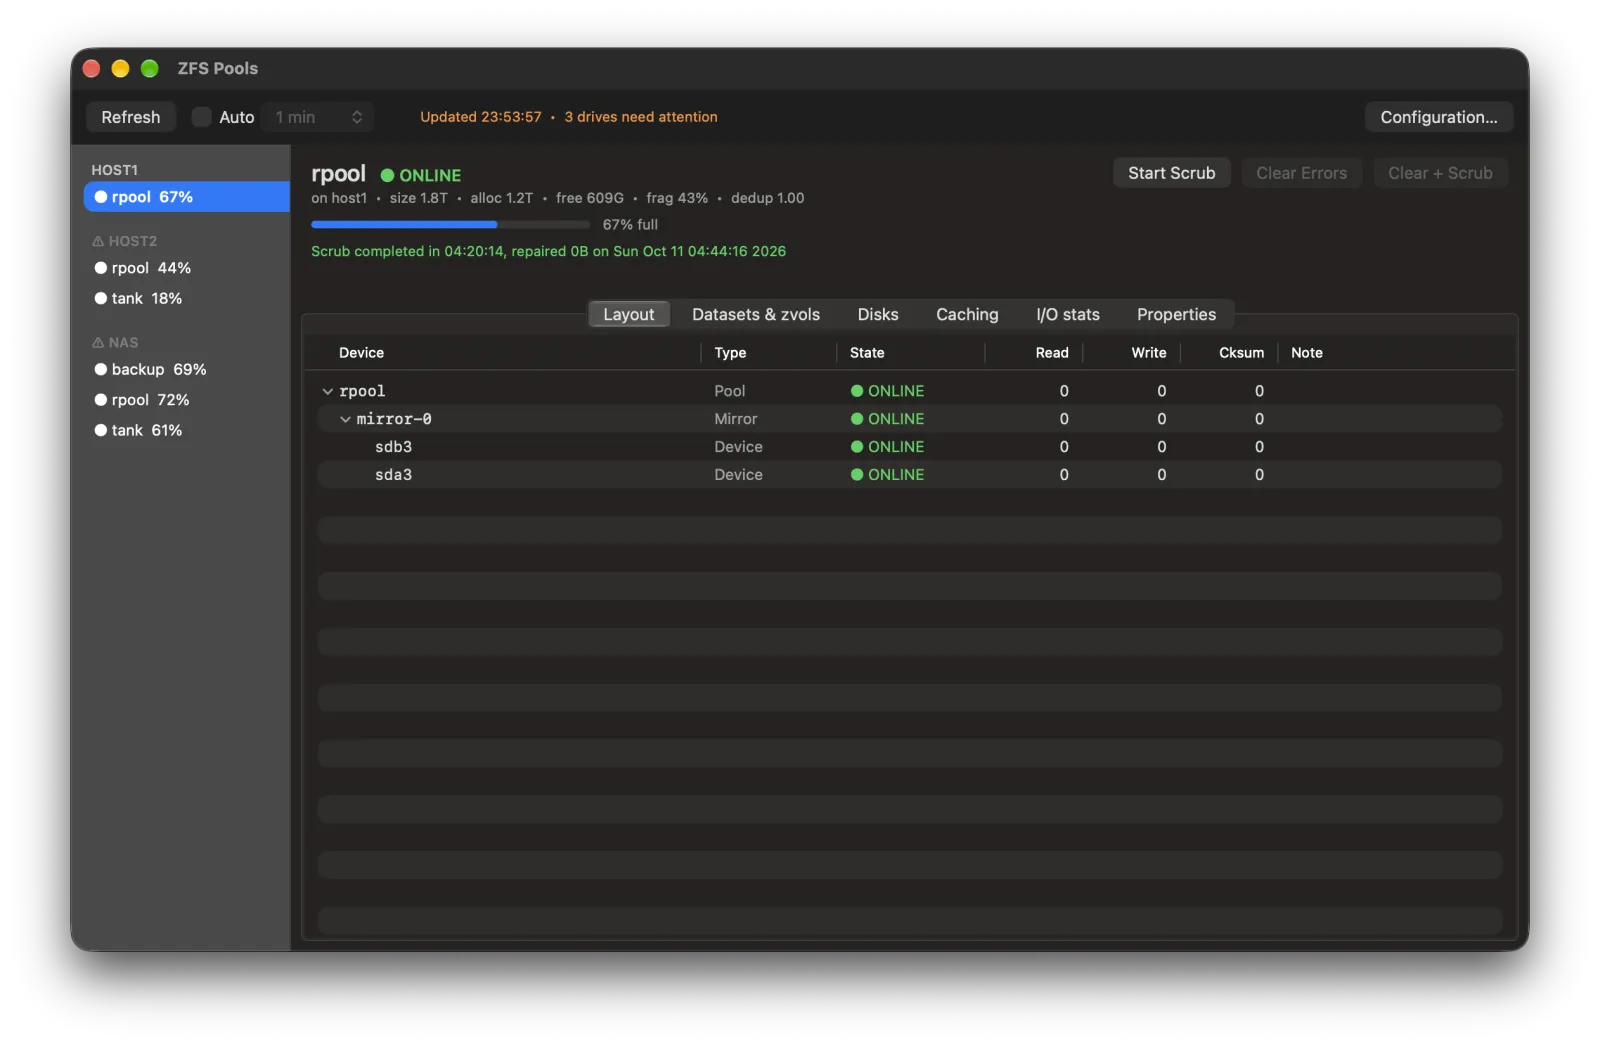
Health per pool and per vdev — ONLINE, DEGRADED, FAULTED, OFFLINE, UNAVAIL, REMOVED, SUSPENDED — with read, write and checksum counts on every device, and the status: and action: advice ZFS prints when something needs doing.

The whole layout

The vdev tree exactly as zpool status reports it: mirrors, raidz1/2/3, dRAID, replacing and spare groups, and the logs, cache, spares, special and dedup sections.

Scrub and resilver

Whether a scan is running, paused, canceled or finished, with percentage and time remaining while it runs, and the duration, bytes repaired and error count of the last one that completed.

Datasets and zvols

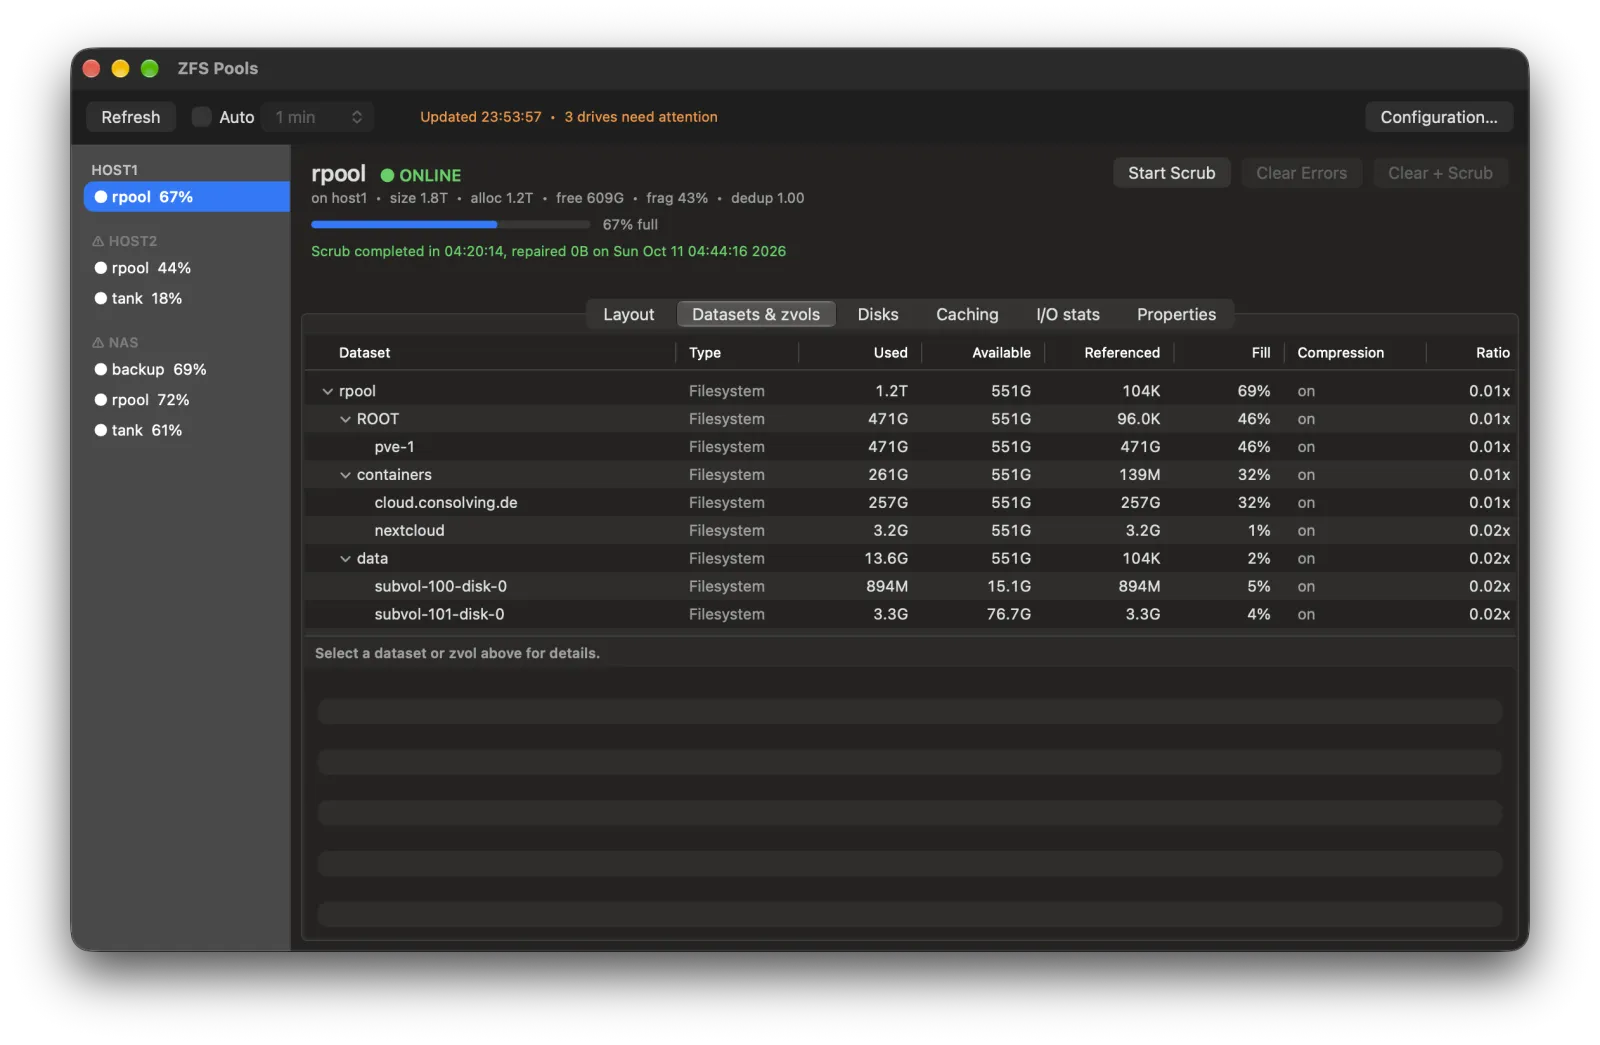
The dataset hierarchy per pool with space accounting, compression and ratio, mountpoint and volsize — and a fill percentage that turns orange past 80% and red past 90%.

Drives, in detail

Vendor, model, serial, size, media type, bus and running hours for every physical disk — plus which pool and vdev it backs and how: whole disk, a partition, or sdg1 → crypt when the pool sits on a LUKS volume. Right-click to copy the lot as Field: value lines.

ARC, L2ARC and I/O

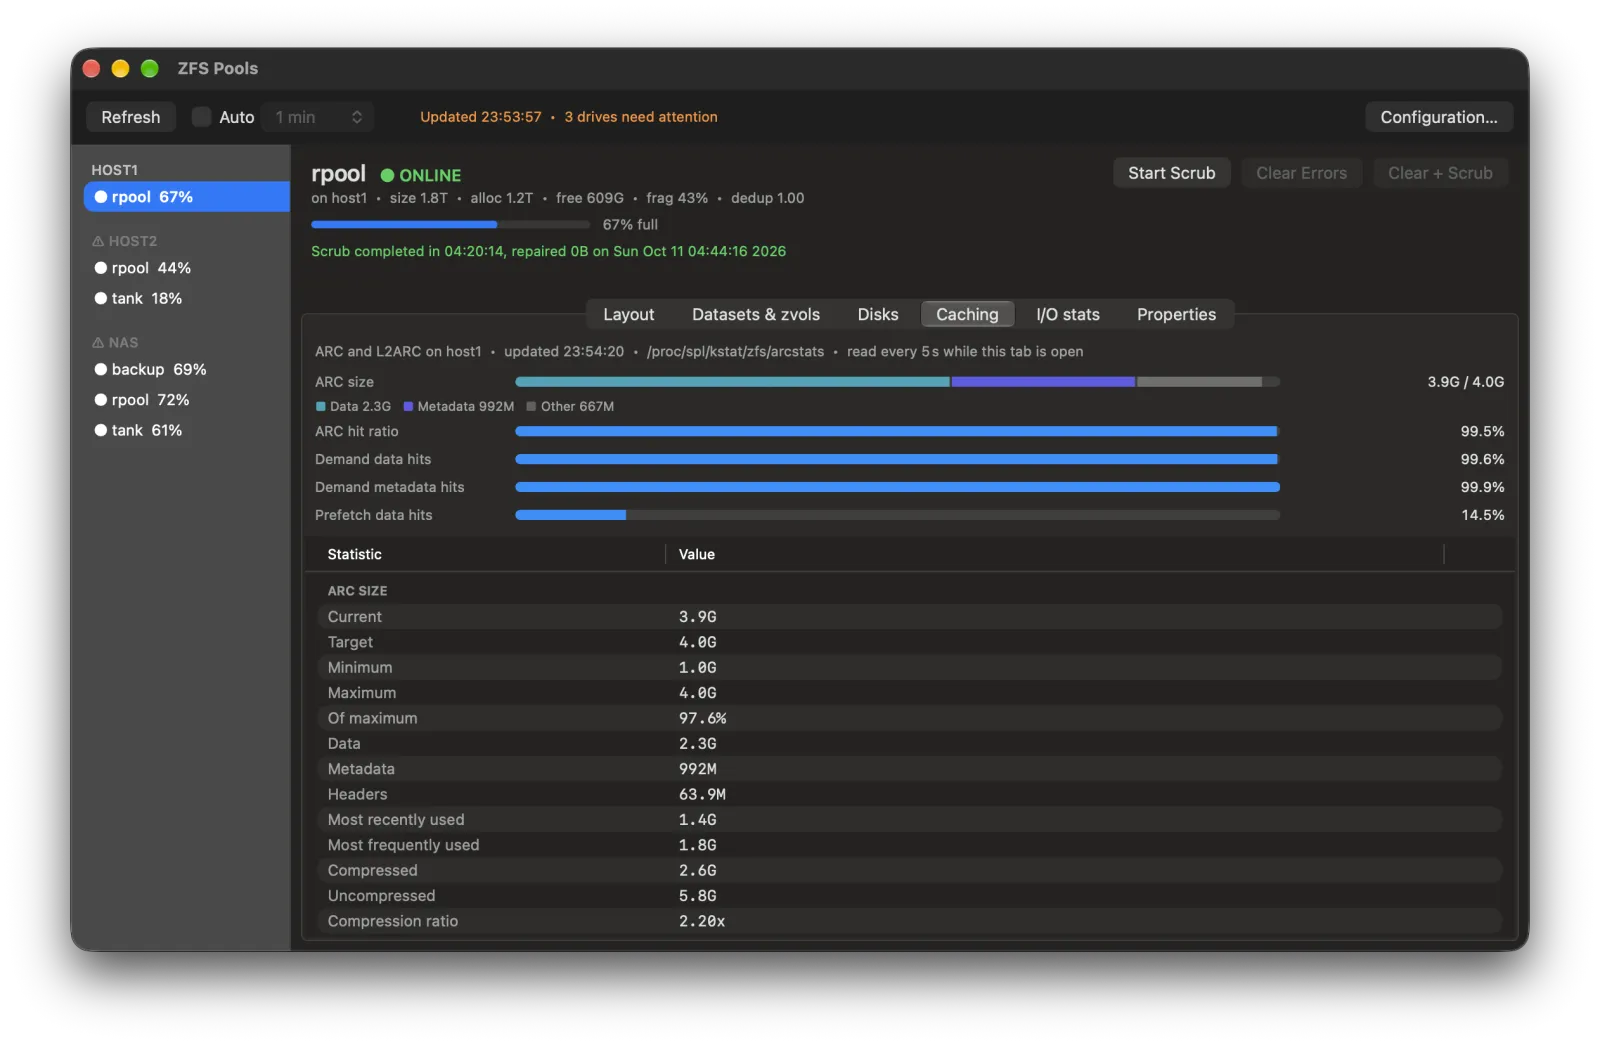
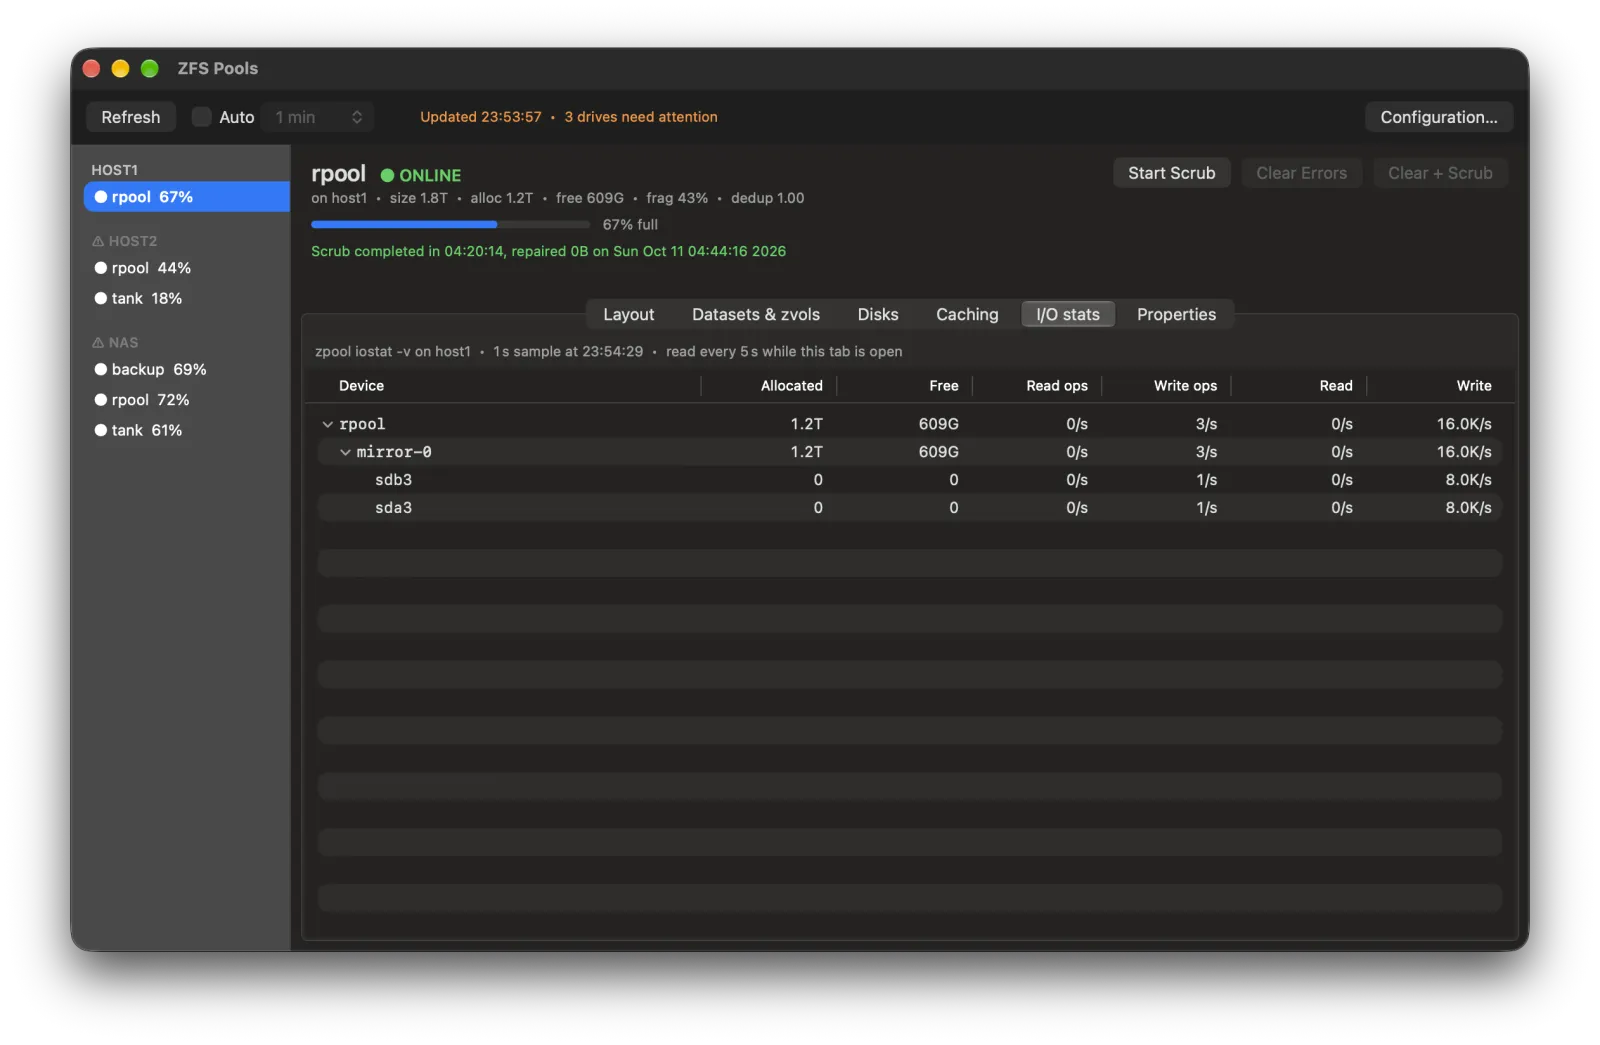
ARC size against its target, the data/metadata and MRU/MFU split, hit ratios for demand and prefetch traffic, the full L2ARC picture, and zpool iostat sampled over one second per vdev and per device. Both read only while you are looking at them.
Six tabs, scoped to what you select

Pick a server or one of its pools in the sidebar. Unknown values are an em dash — never a fabricated zero.

The Layout tab showing a raidz2 vdev tree with per-device error counts
Layout — the vdev tree as zpool status reports it, with per-device error counts.
The Datasets and zvols tab showing the dataset hierarchy with space accounting
Datasets & zvols — the hierarchy with space accounting, fill and compression.
The Caching tab showing ARC and L2ARC statistics with proportional meters
Caching — ARC and L2ARC, with meters for the proportions; polled only while the tab is open.
The I/O stats tab showing zpool iostat output per vdev and per device
I/O stats — zpool iostat -v sampled over one second, per vdev and per device.

The other two tabs are Disks and Properties, which reports every pool property with its source, where the data came from and how old it is.

It tells you when something is wrong

One definition of “how is this host doing”

A host that needs attention is marked in the sidebar with a warning sign — orange for a degraded pool, a worn drive or a host without ZFS, red for a faulted pool, a failing drive or a host that cannot be reached — with the reason in the tooltip and in the detail header. It is a symbol and not only a colour, so it survives both a glance and a reader who cannot tell orange from grey.

SMART, because a pool can lie to you

Each drive's own health self-assessment, temperature, running hours, the attributes that actually predict failure, NVMe endurance and spare capacity, and the result of the last self-test the drive ran. A failing drive is raised into the host's status line — it can be dying while every pool it backs still says ONLINE, which is exactly the warning SMART exists to give.

Unreachable is not the same as unknown

The last successful collection per server is cached on disk, so an unreachable host still shows its pool layout, datasets and drives instead of an empty window. Everywhere that data appears says it is cached and how old it is, and last-known pool health never reads as current.

No agent, no database, no cloud

One SSH connection per refresh, parsed on your Mac. Nothing is installed on the server, nothing is sent anywhere else, and a host that would prompt for a password is reported as unreachable rather than hanging.

Safe by construction

Collection is read-only

uname, zpool list, zpool status, zpool get, zfs get, one disk-enumeration command per platform, smartctl -H -A -l selftest, and — only while their tab is open — the ARC counters and zpool iostat. That is the entire list.

Writes are yours to confirm

Exactly three actions can change anything: start a scrub, clear errors, or both. Each is offered only when it applies, explains what it does in a confirmation sheet before it runs, and nothing else in the app imports, exports or destroys a pool.

Never wakes a sleeping drive

smartctl -t is never used — starting a self-test is a command to the device. -n standby is, so a refresh on a timer cannot spin an idle array back up to ask it how it feels.

Sandboxed, with its own keys

The app runs in the macOS App Sandbox and owns its key store: it never reads your ~/.ssh. Generated keys are real OpenSSH keys, verified against ssh-keygen in the test suite.

Host keys are checked

StrictHostKeyChecking=accept-new against a known_hosts inside the app's own storage: a new host is trusted on first contact, and a changed host key is an error.

Parsers are tested, not trusted

Every parser is a pure function over captured zpool, zfs, lsblk and smartctl output, with real output from real servers in the suite — healthy, degraded, mid-resilver, never scrubbed.

What it needs

On your Mac

  • macOS 14.6 or later
  • One app bundle — no menu-bar agent, nothing running in the background between launches
  • It updates itself: signed updates, checked against a key the app carries, with the install handled outside its own sandbox

On each server

  • An SSH account whose authorized_keys carries the public half of a key from the app's own key store
  • smartmontools for drive health — optional, and the app says so per drive when it is missing
  • Nothing installed, nothing listening, no configuration file

Works against

  • Linux / OpenZFS — Proxmox, Ubuntu, Debian, TrueNAS SCALE
  • FreeBSD / TrueNAS CORE
  • illumos / OmniOS / Solaris

Pools, datasets and scrub state come from zpool and zfs, which are portable. Only drive enumeration is platform specific, so an unrecognised platform costs the Disks tab and nothing else.